TechVerse 2026 First Prize
Chicago Crime Analytics
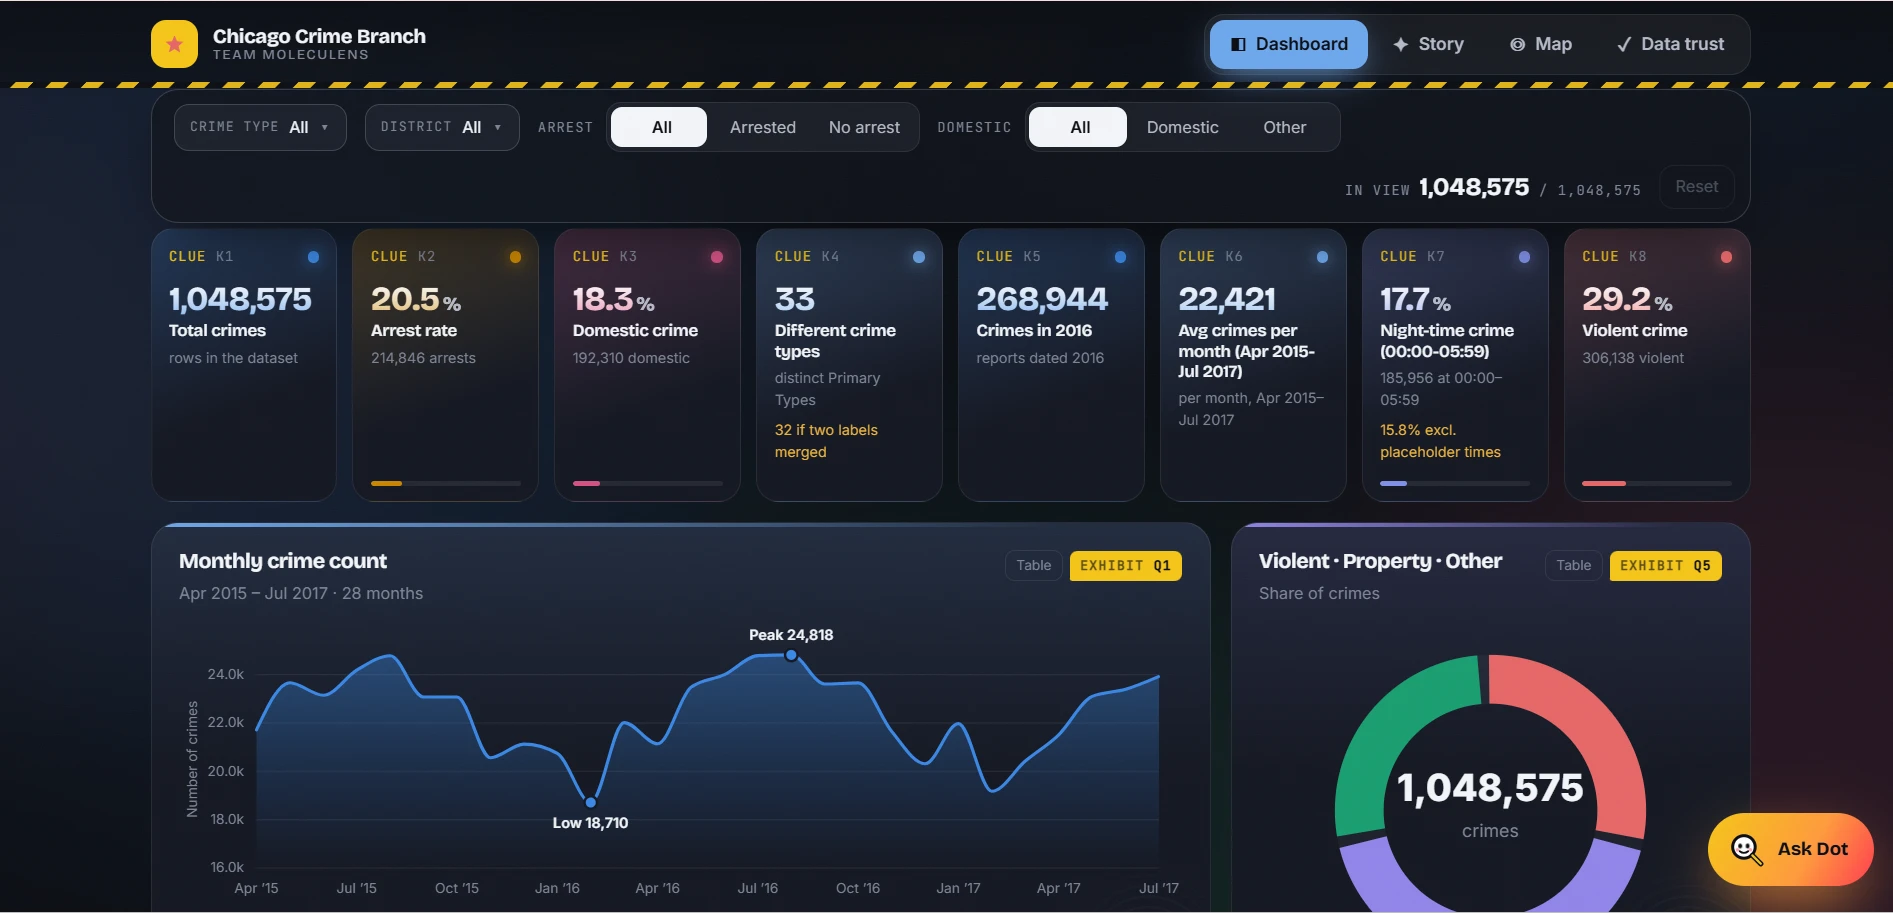
A dashboard that turns 1,048,575 crime reports into 8 KPIs, 10 charts and a district map, with an assistant called Detective Dot and a page that shows exactly how the data was cleaned.
- Built for
- TechVerse 2026 at Ajeenkya DY Patil University, Pune
- When
- 2026
- Team
- Team Moleculens
- My role
- Team leader, in charge of cleaning and visualising the data and drawing the insights.
1.05Mcrime reports analysed
8KPIs
10charts
The organisers of TechVerse supplied an extract of the City of Chicago crime data: more than a million police reports with 22 columns, mixed types, swapped dates and large gaps in the coordinates. The brief was to turn it into something a person could actually read, with a fixed set of KPIs and charts.
The risk with data this size is a dashboard that looks convincing but hides how much has been cleaned, inferred or left out. We wanted the numbers to be both easy to read and easy to question.
We built an interactive dashboard in React and TypeScript on top of an analysis done in Python. All 8 KPIs and 10 required charts sit on one page, and four filters (crime type, district, arrest and domestic) update every number at once.
A Story view writes the findings as short chapters, for example that summer has 17% more crime per day than winter and weekend nights run 69% above weekday nights. A district map shows about 2,400 patches coloured by police district with a panel for totals, top crime types and arrest rate against expectation. Detective Dot, the built-in assistant, answers questions from the project’s own analysis and recalculates live on the filtered data.
A Fair Arrest analysis adjusts arrest rates for crime type, which shows that 86% of the gap between evening and night comes from what was reported rather than the time of day. The Data Trust page lists every cleaning step, metric definition, method and limitation in one place, including that 31% of coordinates are missing and that no rows were removed.
Charts are hand-built in SVG and Canvas with d3 for scales and shapes, with Motion for animation, and the whole dashboard is deployed on Vercel.
The project took First Prize at TechVerse 2026 at Ajeenkya DY Patil University, with me leading Team Moleculens. The live dashboard is open for anyone to filter and question.
- Python
- pandas
- React
- TypeScript
- Vite
- d3
- Vercel
How it works
- 1Source1,048,575 records, 22 columns, 33 crime types and 24 districts from 2001 to 2026
- 2Clean424,638 swapped dates repaired and no rows deleted, with every step logged
- 3Summary8 KPIs: 20.5% arrest rate, 18.3% domestic, 17.7% at night and 29.2% violent
- 4Explore10 charts, four filters and a map of about 2,400 patches coloured by district
- 5AskDetective Dot answers from the project’s own analysis and recalculates on the filtered data